Start with one place.
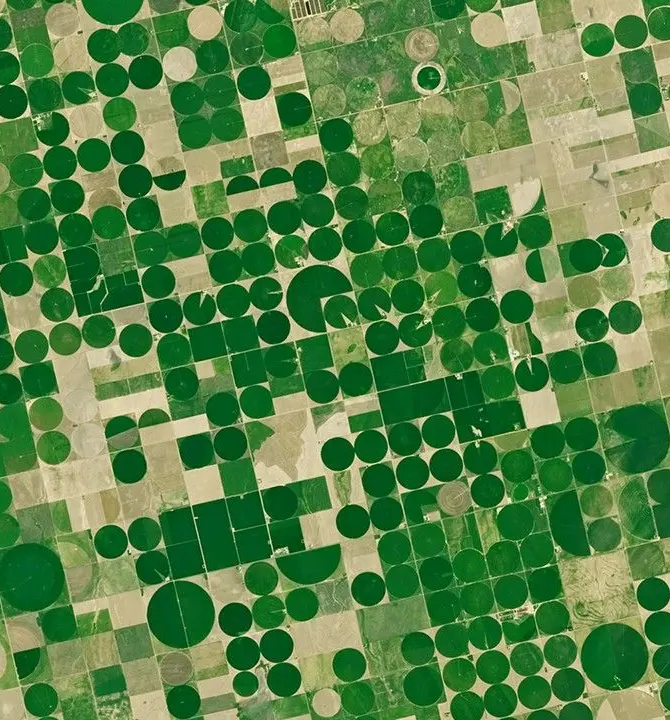
This is farmland in Kansas, seen from orbit. Each green circle is a field watered by a rotating sprinkler arm.
One picture shows what the fields looked like on one day. It can't tell you what they do over a year.
- Image
- Landsat · NASA/USGS
Now watch it for a whole year.
Europe's Sentinel satellites pass over the same spot every few days. Sentinel-2 takes optical pictures, like a camera. Sentinel-1 sends radar pulses that see through cloud and darkness.
Stack a year of passes and the place shows its rhythm: when fields green up, when they're harvested, when the ground lies bare or wet.
- Inputs
- Sentinel-2 optical · Sentinel-1 radar
Squeeze the year into 128 numbers.
TESSERA reads the whole stack, pixel by pixel, and boils each 10 × 10 metre square down to a list of 128 numbers. That list is called an embedding.
Think of it as a fingerprint for how that patch of ground behaves over a year. No single number means "wheat" or "forest". Together, they capture the pattern.
We draw the numbers as coloured stripes. The values on this page are illustrative, not real model output.
Similar places get similar fingerprints.
A rainforest in Brazil and one in Borneo are about 19,000 km apart, almost on opposite sides of the planet. Their fingerprints still look alike. A crop field or a city block looks completely different.
That is what makes embeddings useful: you can compare places by their numbers alone, before anyone has labelled them.
Ask the map: where else looks like this?
Pick one spot and look for every pixel with a similar fingerprint. The matches light up in pink. Tap the map to try another spot, and use the slider to make the match stricter or looser.
This demo compares the colours in the picture, a simplified stand-in for the full 128 numbers.
Now do it for every pixel on Earth.
There is one embedding for every 10 m pixel of land on Earth, for each year from 2017 to 2025, with a new year added annually.
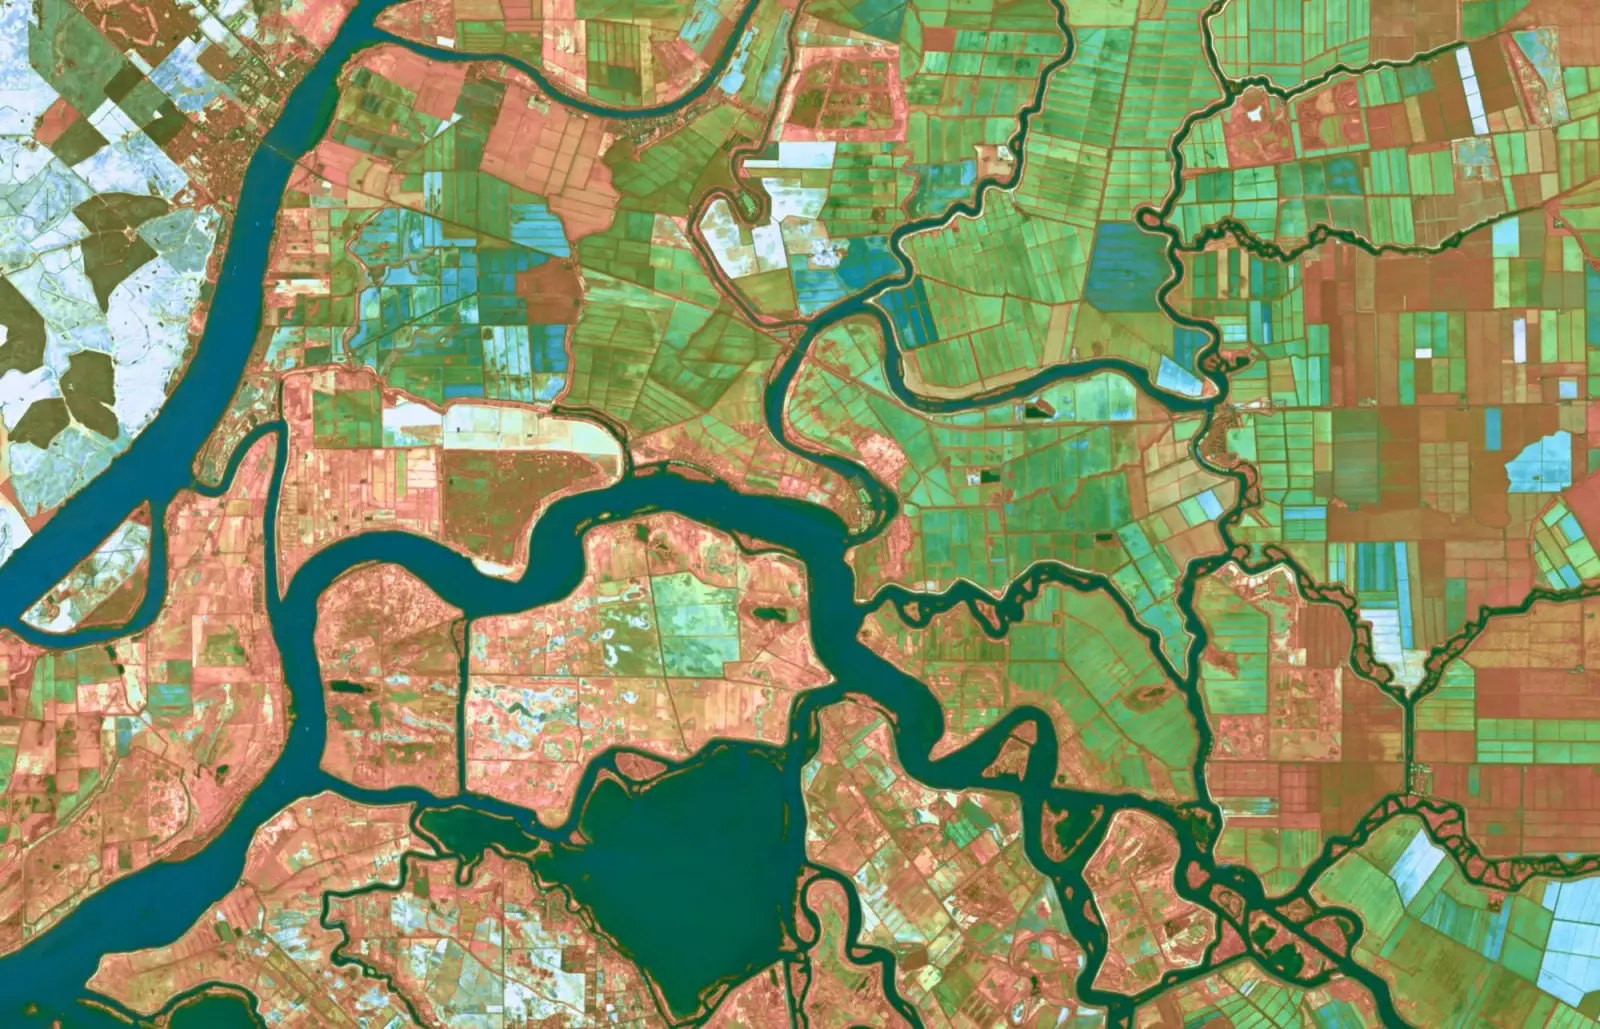
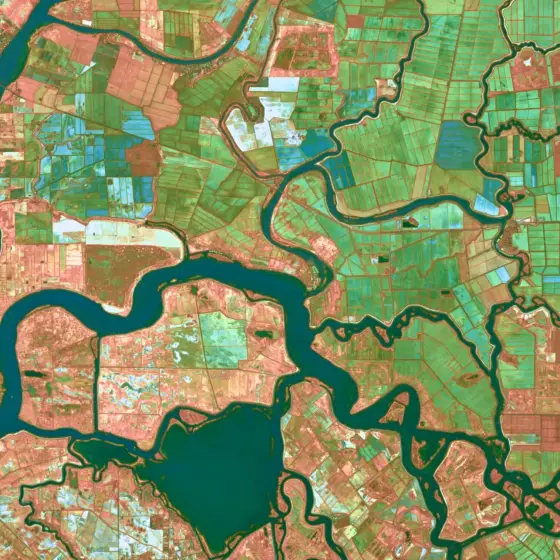
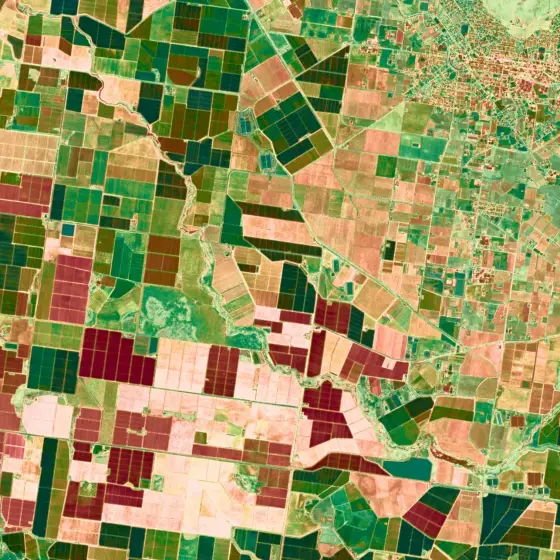
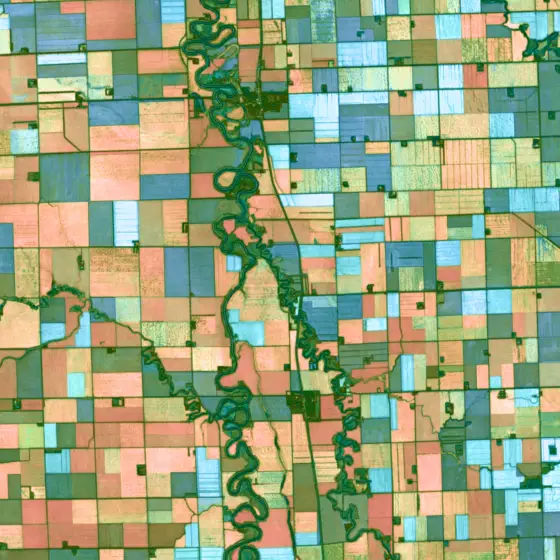
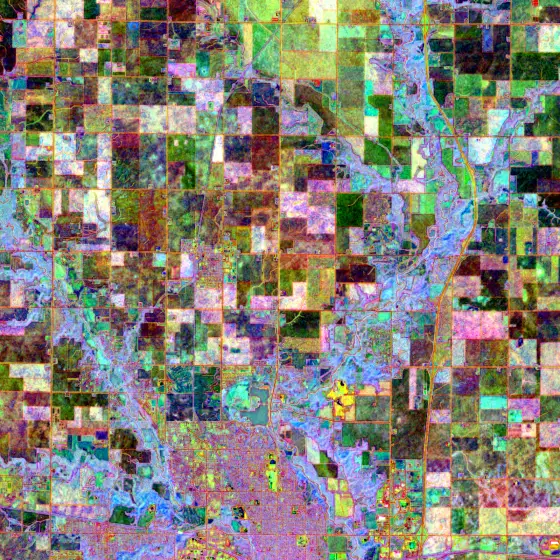
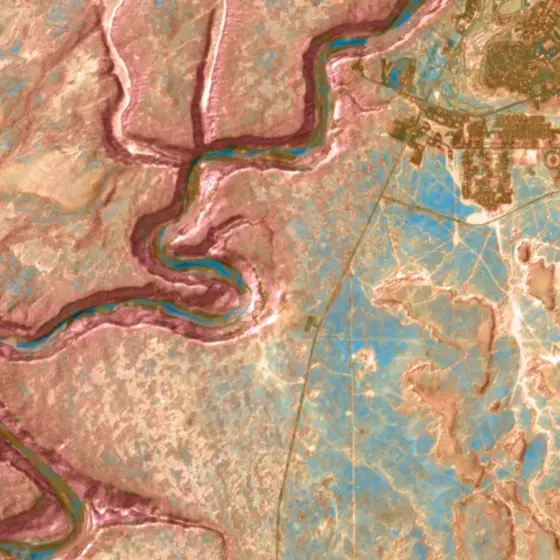
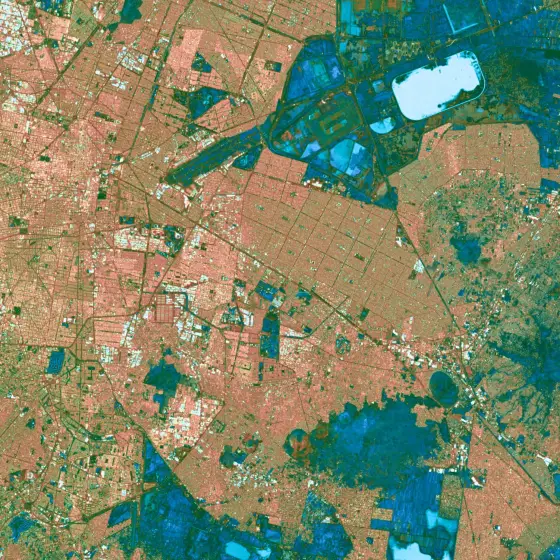
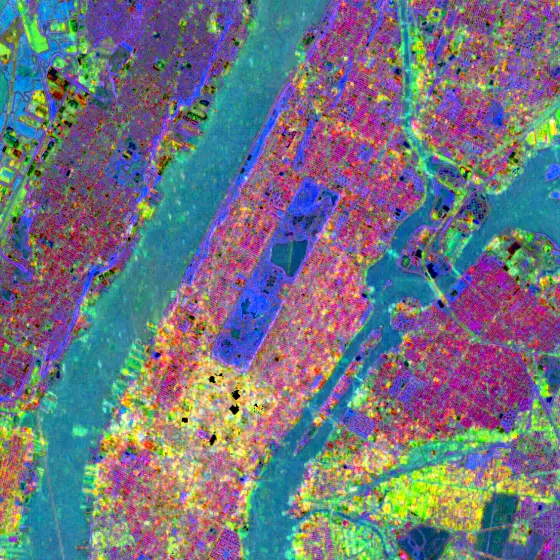
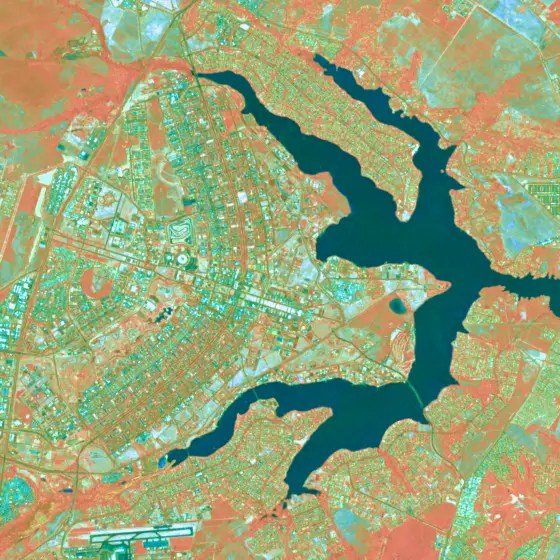
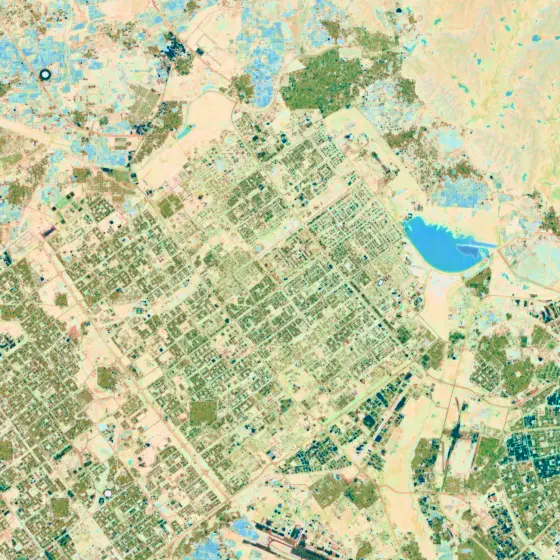
These pictures show real 2025 embeddings, turned into colour. Rivers, fields, cities and canyons stand out on their own, without anyone drawing them in.